Wealth is distributed very differently among individuals, which becomes evident when compared to a random distribution. Such a distribution occurs, for example, when a thread is randomly cut into many pieces, with the scissors being set at a random location each time. If the wealth of all people in Germany were distributed in this form, the wealthiest person would have ten thousand times less than today, while the average fortune would remain unchanged.
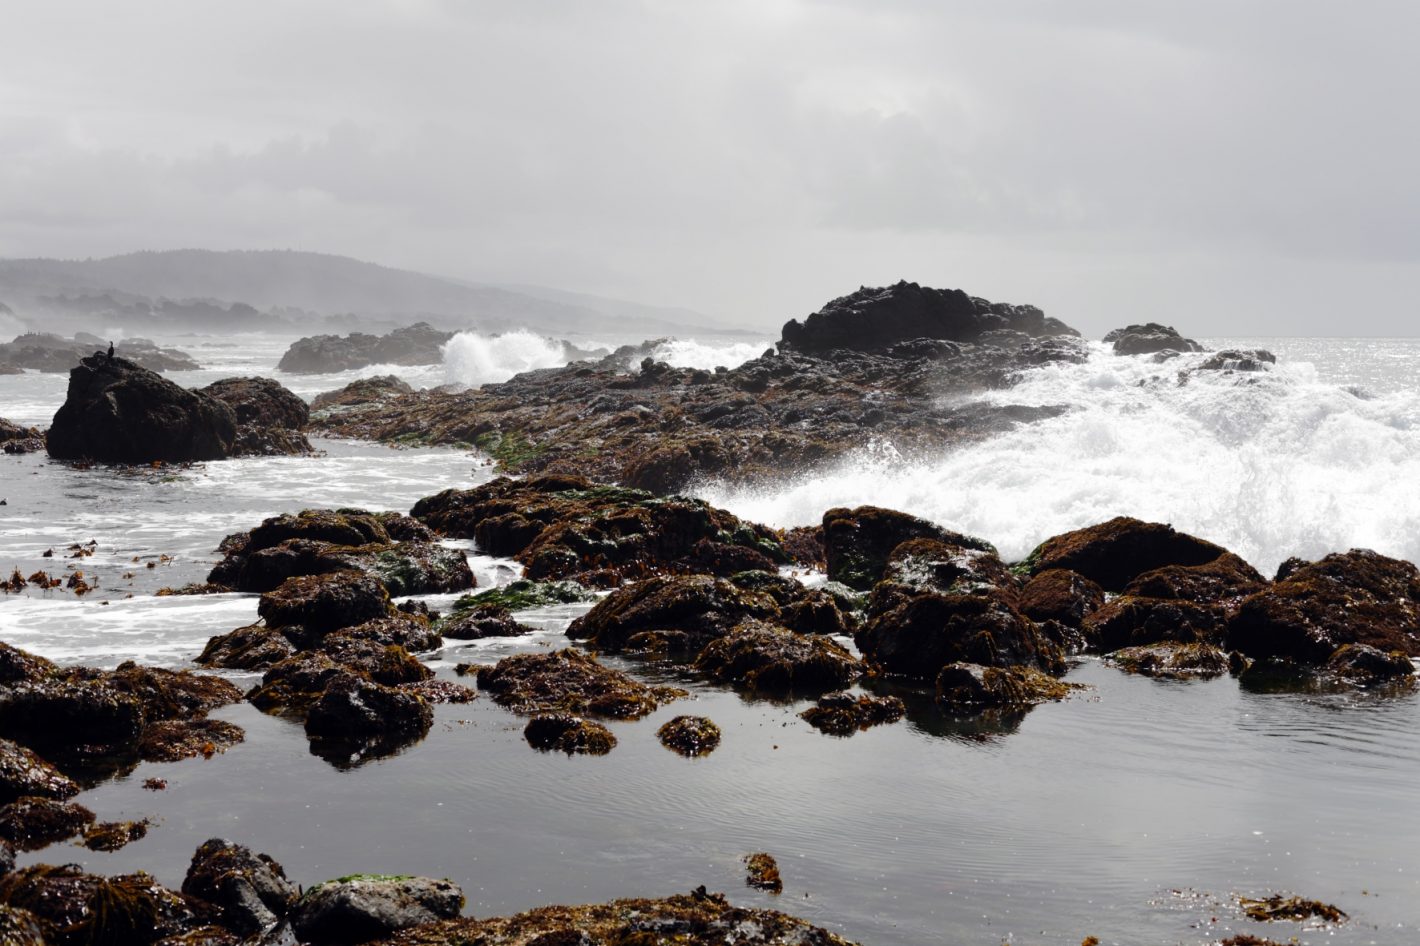
Meter-high waves break on rocks and on the bank only centimeter-high waves arrive. I took this photo during a research stay in California. This picture accompanied me during my doctoral thesis dealing with inner ear mechanics. There are the barely audible small shallow waves in the foreground and behind it the loud raging sea. There is a big difference: centimeters or meters. However, our ear can capture a much wider dynamic range. It is about one to a million regarding air vibration, from the threshold of hearing to the threshold of pain.
Money is a self-created and decisive factor in our society. The smallest unit that I use is the cent with 0.01 euros. The most massive amount of money allocated to an individual in Germany is over 10 billion euros. We have no direct organ of perception for the money. Our imagination is trained through our sensory organs and very much challenged with this dynamic range from one to one trillion. To understand the relations, it helps to put the relative size of money to known and more natural ascertain things.
There are many ways to capture relations. For the money, concerning an individual, there is monetary wealth as an integral, comprehensive, and descriptive quantity. This represents the part of the salary, capital income and monetary value which is accumulated over the years, regardless of whether it is salary, heritage or stock. From my point of view, the accumulated wealth largely determines the size of the decision space of an individual in our society and thus represents the actual potential; while the income with the unit money per time, is a measure of flux and usually considered to a month or a year. The money does not have this limited lifetime.
As explained in the Federal Government’s report on the quality of life in Germany, the Gini coefficient of wealth describes the wealth distribution on a scale from zero to one. With a value of zero everyone would have the same amount of assets. A value of one would imply that a single person would have all assets. The value given from the year 2010 of 0.78 is somewhere in between. The relation to numbers of other states is moderated in the report since there are different investment strategies in other countries. For a general overview, scalar quantities such as the Gini coefficient are useful for states, but they are neither directly related to individuals, nor allow intuitive observation. Therefore, for me, it is essential to analyze with respect to individuals, as they decide in the end.
The gold meter as a visible measure of fortune
To better understand the relations, it is helpful to translate the abstract size of the monetary value into a tangible measure. One form of visualization is the conversion of the monetary value to a chain of gold bars which strung together because a length scale is easier to understand than the abstract money. A single gold bar is about a quarter of a meter long and weighs about 11.3 kg. Thus, such a meter of gold weighs about 45 kg. The gold price makes it possible to express the weight in cash (in this post, I prefer to use numbers from 2013 to be consistent with available statistical numbers). Based on the price of gold, the price is around EUR 1.4 million per meter. The following table lists different amounts of money in euro and the measure of the gold meter.
Monetary values compared to the length in gold meters and typical sizes in nature. Monetary values refer to data from Germany in 2013.| Size | Value in Euro | Gold meter | Size in nature |
|---|---|---|---|
| One atomic layer | 0.0028 | 0.2 nm | Atom |
| One cent | 0.01 | 7.2 nm | Protein |
| One euro | 1.00 | 0.72 μm | Bacterium |
| Protected wealth of Hartz IV | 10,050.00 | 7.2 mm | Hazelnut |
| One kilogram gold | 30,646.09 | 22 mm | Cherry |
| Gross income of household | 49,032.00 | 35 mm | Strawberry |
| Wealth per inhabitant | 61,099.41 | 44 mm | Apricot |
| Randomly richest | 1,147,572.06 | 0.83 m | Shoulder height wolf |
| One meter | 1,390,083.35 | 1 m | Shoulder height sheep |
| Ten times billionaire | 10,000,000,000.00 | 7.2 km | Elevation of the Himalayas |
| Total Wealth of Germans | 4,923,738,900,000.00 | 3,500 km | Continental plate |
This measure captures now different sizes. According to the federal statistical office, the average wealth of one individual in 2013 is EUR 61,000, which corresponds to approx. 4.4 cm of the gold length. The wealth of the entire German population results from the multiplication by the number of people of about 80.6 million, which leads to a distance in gold length of about 3500 km – the air route from Berlin to Tenerife.
The wealth is neither equal nor randomly distributed
The existing distribution is one of many different ways of distributing wealth among individuals. One option is the division into equal pieces. To illustrate this a long line, extending over one hundred lines is divided into a total of ten thousand equally sized pieces, in the following figure. For this case of equal parts, the Gini coefficient would be zero. However, there is a considerable effort for the implementation: Each piece has to measure precisely 4.395337 cm to distribute the cent correctly. It has to be cut exactly to a few atomic layers. No part would be bigger or smaller, and as soon as a person gives something away, this ideal is lost.
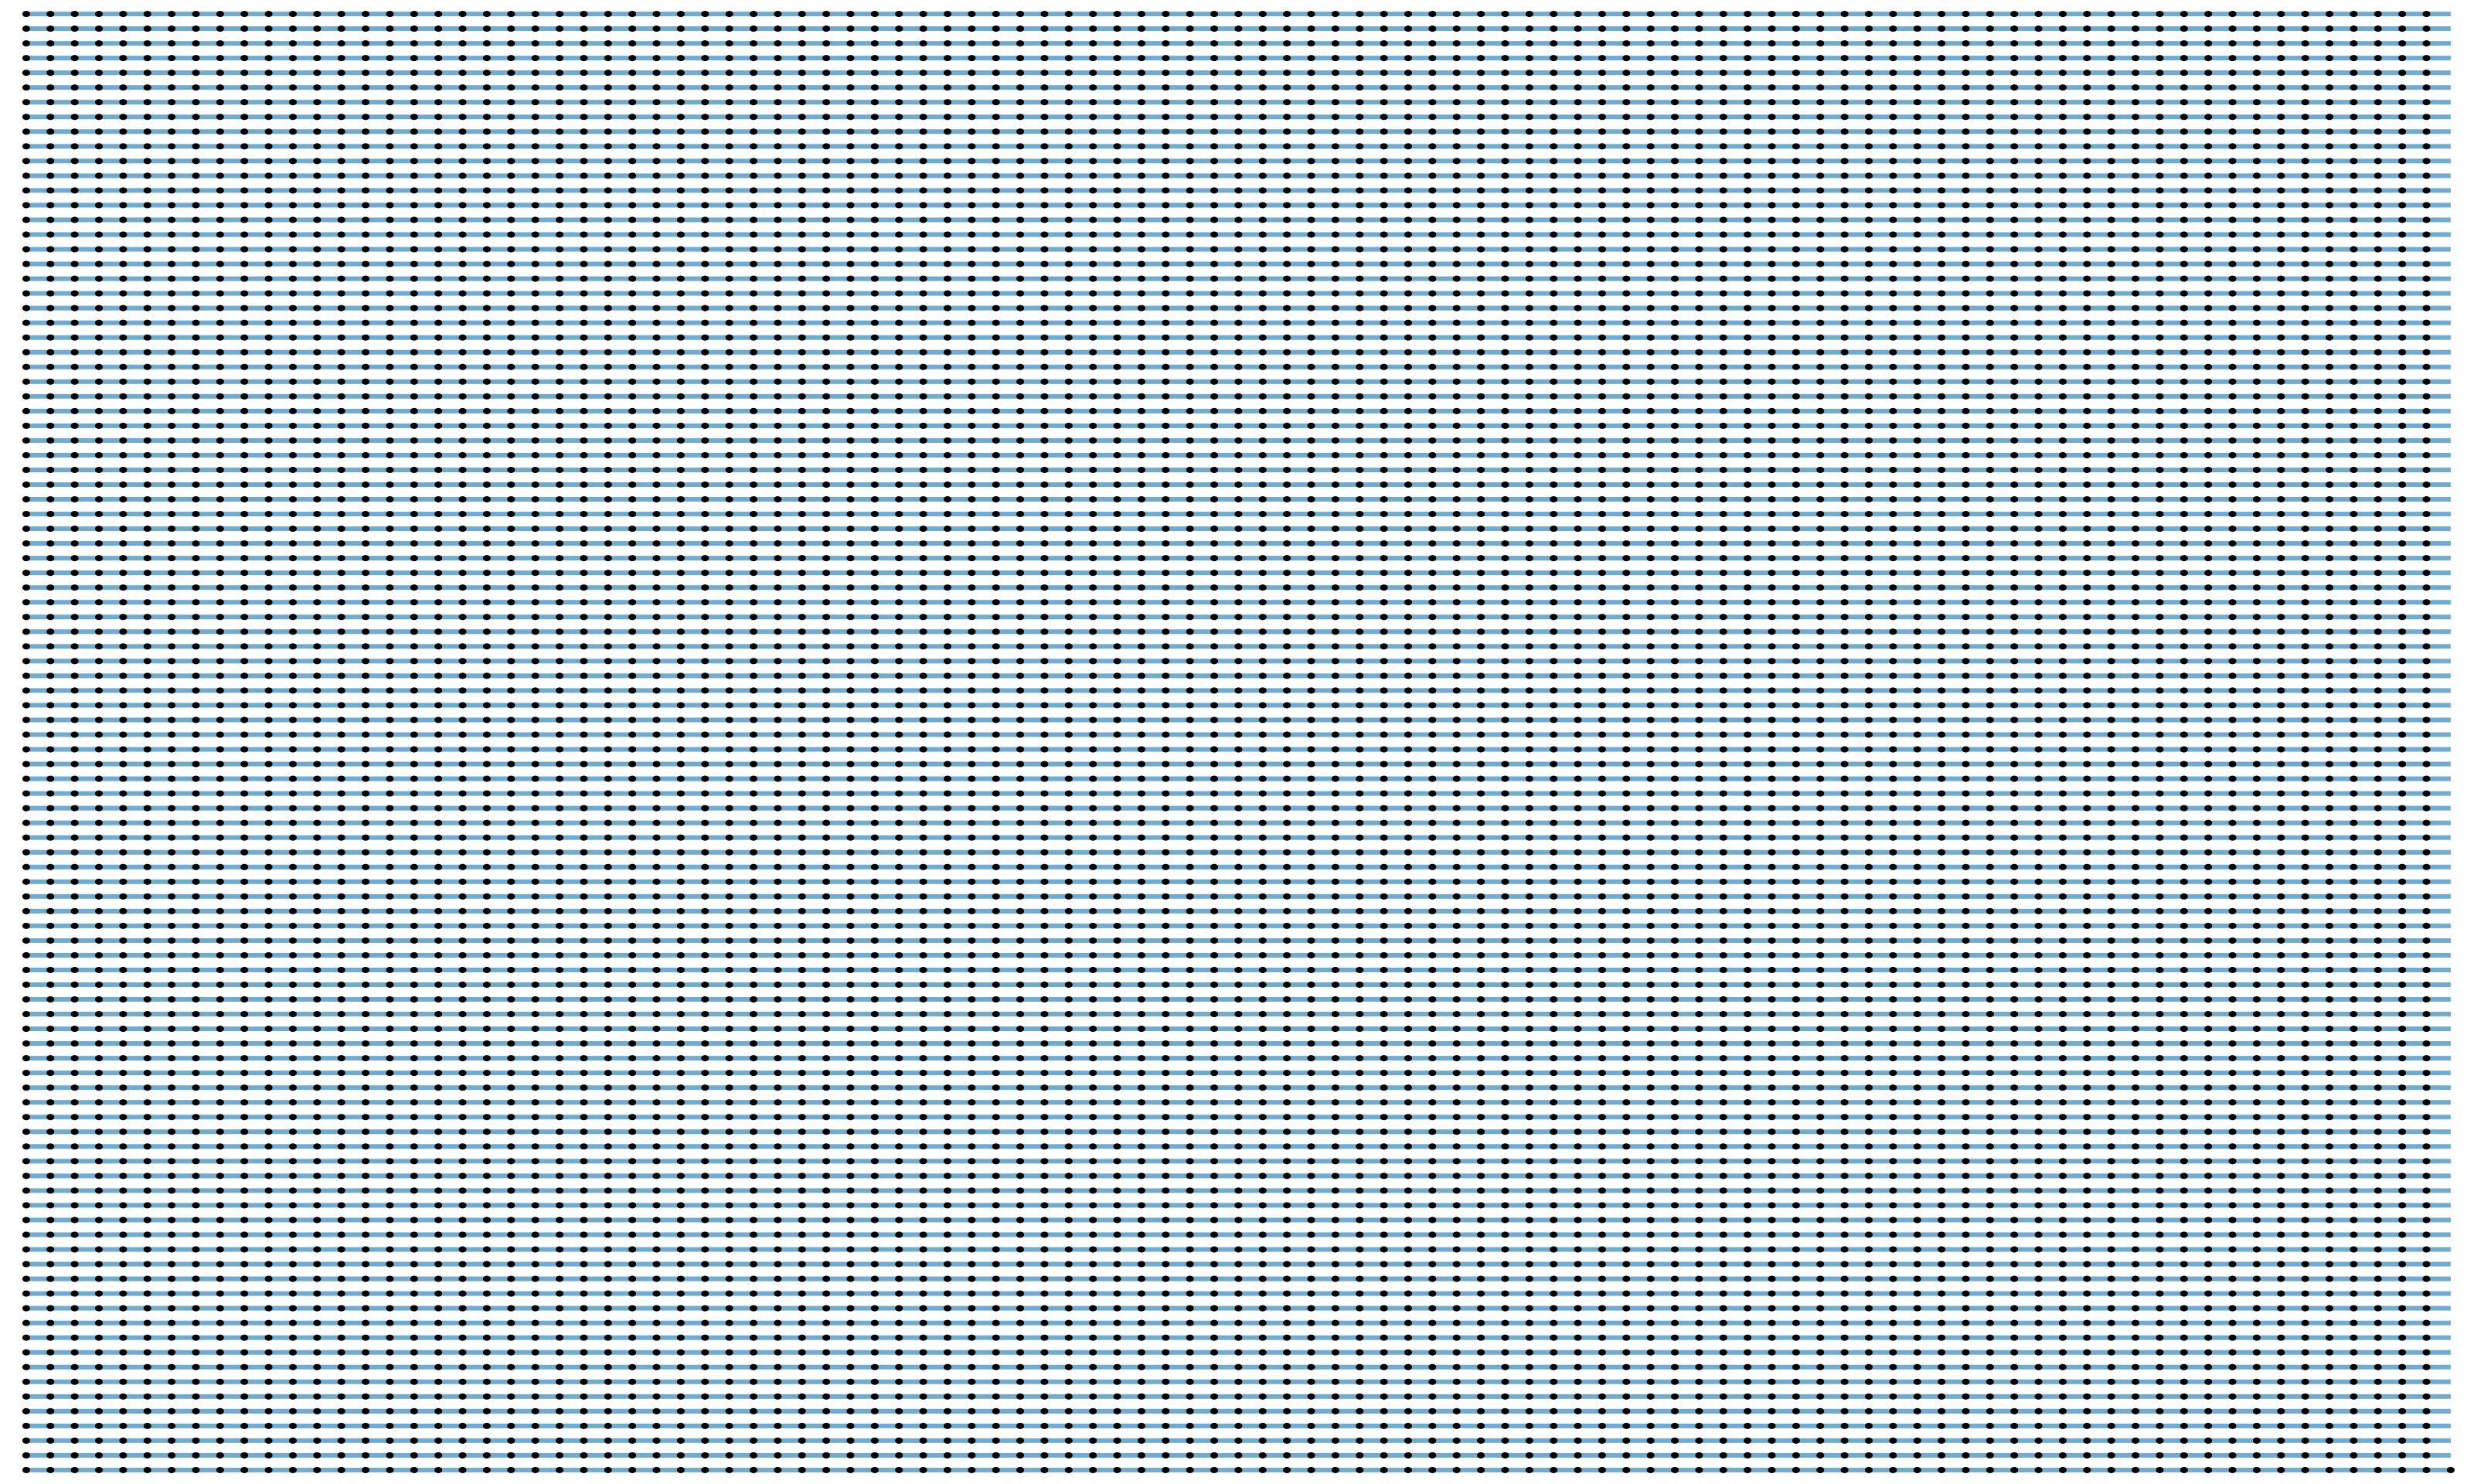
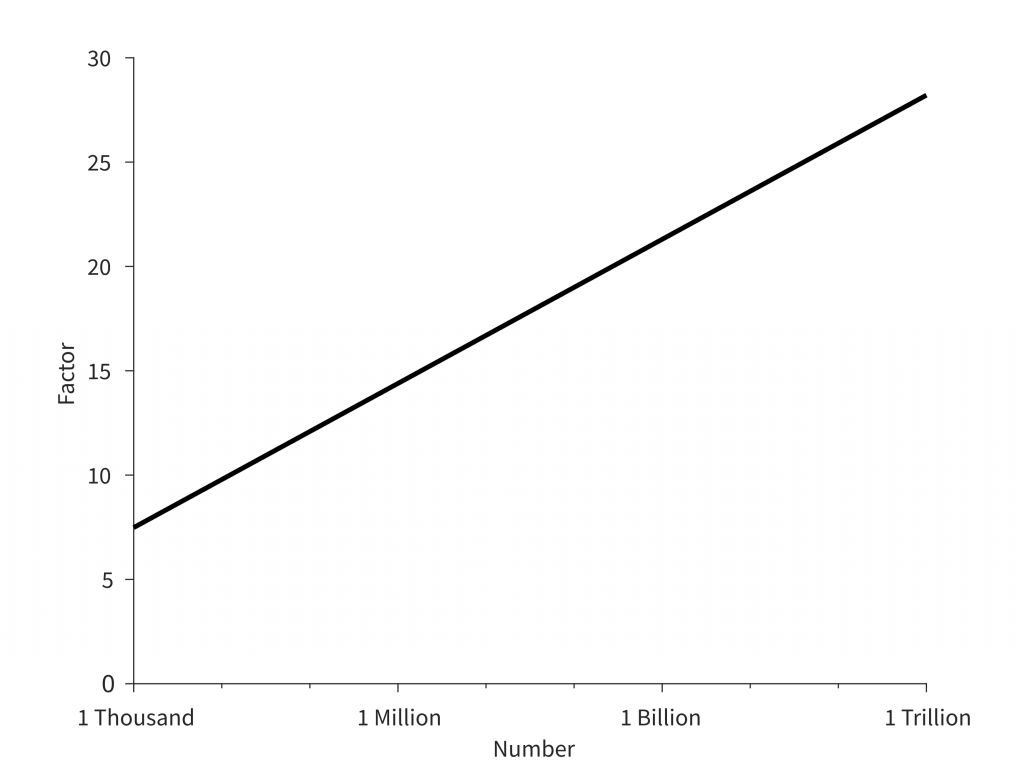
An alternative is to cut at random places and not to prefer any location. On average, all pieces would be about 4.4 cm long, but now all have different lengths. Interestingly, it is expected that not a single part of the 80.6 million would be longer than about 80 cm, which is 18.2 times the mean. This factor, which describes the ratio of extreme value to mean value, depends solely on the number of units, here the population, and is shown as a function of this in the graph below. The most extended piece would weigh about 34 kg and would not only be tangible but also by an individual well to wear.
A line is again divided into ten thousand pieces to illustrate this but now has been separated at randomly chosen locations. As seen in the following illustration, the parts are of different lengths. However, there is a typical length equal to the previous case with equal pieces.
Vast differences exist especially among the rich
In reality, significantly larger individual assets exist than the extreme value would suggest in a random distribution. Even if large assets cannot be easily converted into cash, not to mention paid overnight, the estimates are related to our monetary system. When looking at the Forbes list of the world’s wealthiest citizens of recent years, there were always some Germans with more than 10 billion euros on this list. Such a tenfold billionaire rules over a considerable fortune. Ten billion euros corresponds to a distance of over 7 km of gold, which weighs about 326 tons and can neither be covered by one’s own hands nor carried by one’s strength and makes it clear that the wealth is not a randomly distributed.
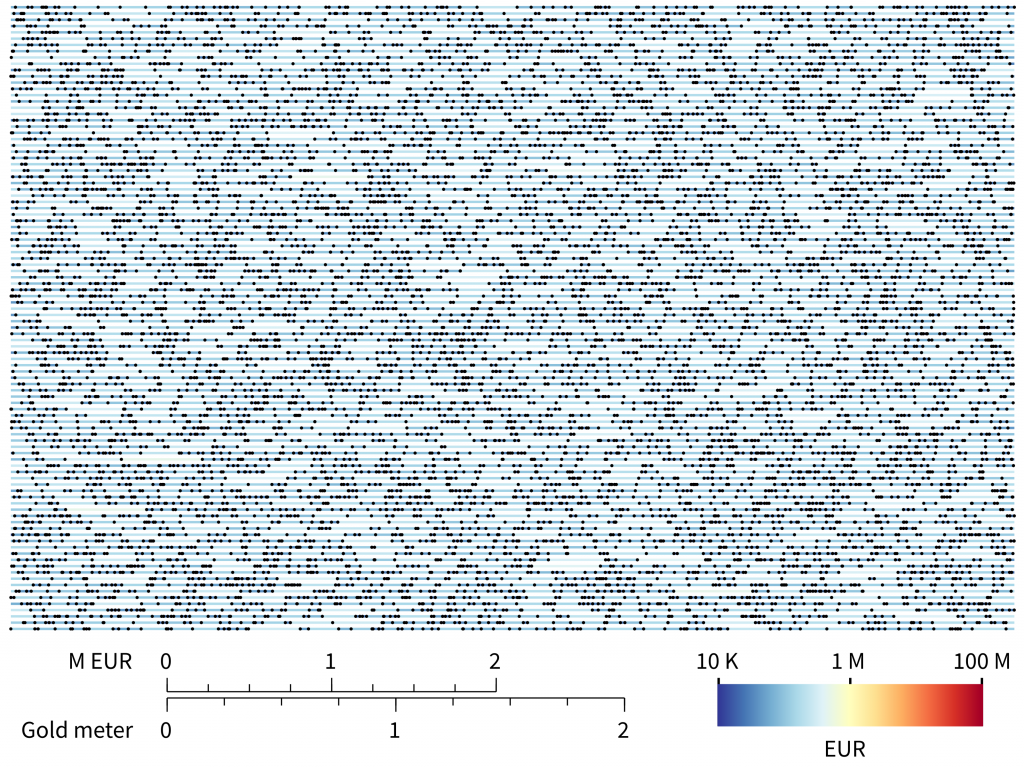
For the description of the real distribution of wealth in Germany, the income and consumption sample provides information, whereby the group for assets over one-half millions of euros is not further differentiated. Based on the Forbes list and supplemented by an analysis of the journal Bilanz from 2016, with the 750 wealthiest Germans, the distribution of wealth in Germany can be estimated. For this data, the figure below shows a random sample of Germans. Again, the total length is divided into ten thousand pieces.
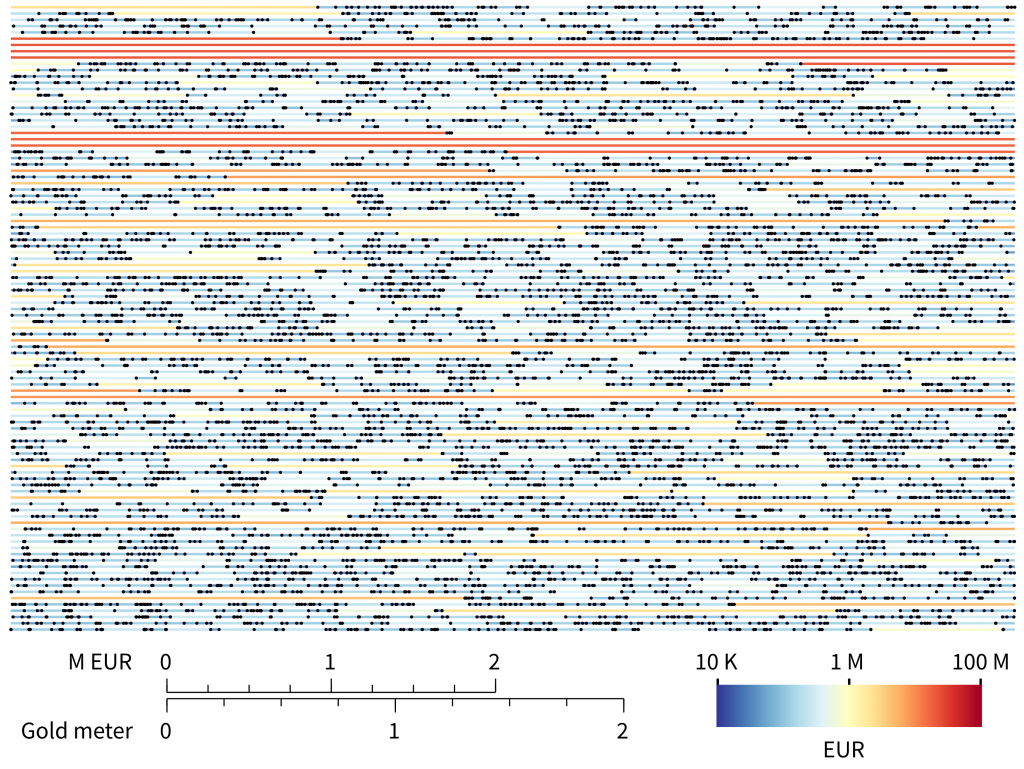
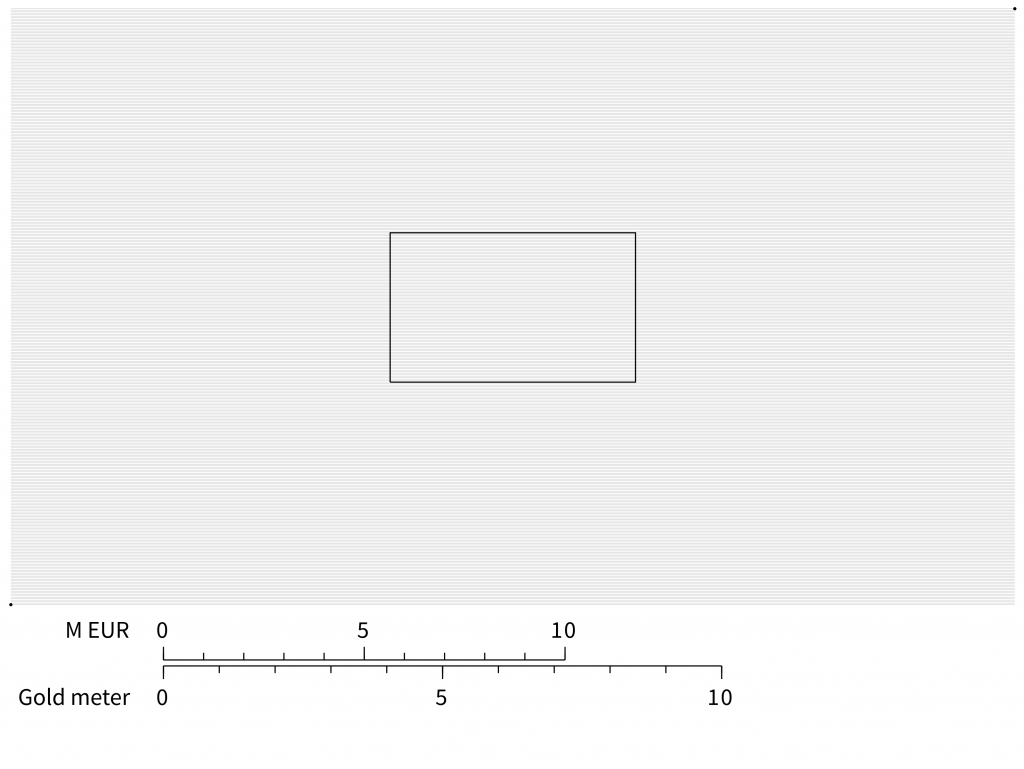
A ten-fold billionaire is only with a probability of 0.01 % in this sample, not in the specific case and would alone fill almost 17 such graphs. The following figure shows the corresponding value.
There are different approaches to explain the real distribution. A plausible model for me (Yakovenkov & Rosser; Colloquium: Statistical mechanics of money, wealth, and income; 2009, arxiv.org), which describes the characteristic shape of wealth and income distributions in different countries, is based on that small assets tend to change over time through random events, while large assets grow and shrink over time relative to their value. For the smaller assets, this results in a random distribution. However, this is not the case for the more substantial assets. They follow a Pareto distribution, where a small number of high assets contribute more to the total assets of all involved than the high number of small assets. Moreover, the relative differences in the large individual assets are also higher. When analyzing the list of all wealthy people sorted the amount in the descending order this becomes clear. On this list, the poorest of the thousand richest, standing at position 1,000, has less than one percent of the wealthiest. Whereas the one who is one thousand places below the middle place still has 99.99 % with respect to the central position.
Three forms of asset growth can explain the relationship between income and wealth distribution: income through work, income from capital, and change in the value of one’s assets (Berman, Ben-Jacob and Shapira; The Dynamics of Wealth Inequality and the Effect of Income Distribution; PlosOne, 2016, 0154196). To map the real data, it is crucial that higher assets make a higher percentage gain.
Finally, a relative analysis to illustrate the differences between assets: Each year, the Herbert Quandt Media Prize endowed with 50,000 euros is awarded, which is a grand sum and corresponds approximately to an average household gross income. The fortune of the two siblings Quandt is about 30 billion euros. If I put the prize money in relation to the per capita average assets of about 61,000 euros, this apparent generosity relativizes to a virtual prize money of about 10 cents. For this small amount, I do not even ask the tax office for a tax-deductible donation, let alone offer a reward.
Wealth as a measure of potential to act
Even if billions can be written down soberly with our number system, the magnitudes of the various individual assets cannot be grasped by our senses. First of all, they are abstract numbers, because the different possibilities of individuals resulting from the social context are related to these estimated monetary values, but they also require qualities that are not directly tangible, such as security, acceptance, and continuity. For an evaluation of absolute size, the product of the individual quantitative property and these qualitative characteristics is crucial. Since the latter is distributed more evenly, just because it is based on the interaction of humans, the distribution of wealth is an indicator of the distribution of the potential to act of individuals in our society. With the measurement in the form of the gold meter, they become for me a bit more (in)tangible.